

Margins look healthy at the company level. Revenue is moving. Orders are shipping. The plant manager says utilization is decent, and the sales team insists pricing is competitive. Yet EBITDA keeps slipping, cash gets tighter every quarter, and nobody can point to a single root cause.
That's usually when production cost analysis stops being an accounting exercise and becomes a leadership issue.
In manufacturing, hidden cost problems rarely sit in one obvious line item. They sit inside quoting assumptions, overhead allocation, routing inaccuracies, scrap that gets normalized, and SKUs that should have been repriced, redesigned, or retired a long time ago. CEOs, founders, and private equity operators who scale well understand this early. They don't wait for the annual audit to tell them margin quality is deteriorating.
That perspective matters even more in advanced manufacturing, where complexity gradually compounds across product lines, customer requirements, and plant-level decisions. Hasit Vibhakar built his career in exactly that environment. In 2002, he founded a Semiconductor Manufacturing company and successfully took it public on the US Stock Exchange, achieving a peak market capitalization of $250 million USD before a successful exit, as noted in his business exit background.
Table of Contents
- Beyond the Balance Sheet Why Production Cost Analysis Matters
- Deconstructing Your Production Costs
- A 5-Step Methodology for Accurate Cost Analysis
- Worked Example A CNC Machined Aerospace Component
- Using Analysis for Pricing Budgeting and PE Diligence
- Common Pitfalls and Strategic Improvement Levers
Beyond the Balance Sheet Why Production Cost Analysis Matters
A manufacturer can hit shipment targets and still destroy value one job at a time. That happens when leadership reviews consolidated financials but never sees the economics at the product, process, and customer level. Production cost analysis closes that gap.

The strongest operators move this work out of the back office and onto the CEO dashboard. They use it to decide which products deserve capital, which customers deserve attention, and which operations need redesign before they consume working capital. That same discipline also strengthens liquidity because cost accuracy and cash discipline are tightly linked. A company that understands unit economics usually manages inventory, payables, and production timing with more control. That's why working capital optimization belongs in the same executive conversation.
Cost visibility changes exit outcomes
Private equity buyers and strategic acquirers don't pay premium valuations for noisy margin stories. They pay for control, repeatability, and a believable plan to expand earnings after close. If your plant can't explain true product cost by line, SKU, and routing logic, buyers assume there's downside they haven't found yet.
Practical rule: If management can't defend product-level profitability in a diligence room, someone else will write the adjustment for them.
That's also why serious operators clean up the financial story before they go to market. If a business owner needs a practical primer on how to prepare financial statements for sale, that work should sit alongside cost normalization, not apart from it.
This is where strategic operators separate themselves
A weak company asks, “What did we spend?” A strong one asks, “What did it cost to make this exact part, on this exact machine path, under this exact commercial agreement?”
That difference sounds subtle. It isn't. It's the difference between scaling profitably and scaling confusion.
Deconstructing Your Production Costs
Most cost systems fail before the math even starts. The failure happens when teams classify costs loosely, mix plant expenses into product costs without discipline, or treat all factory spending as if it behaves the same way. Production cost analysis only works when the cost structure is built correctly.
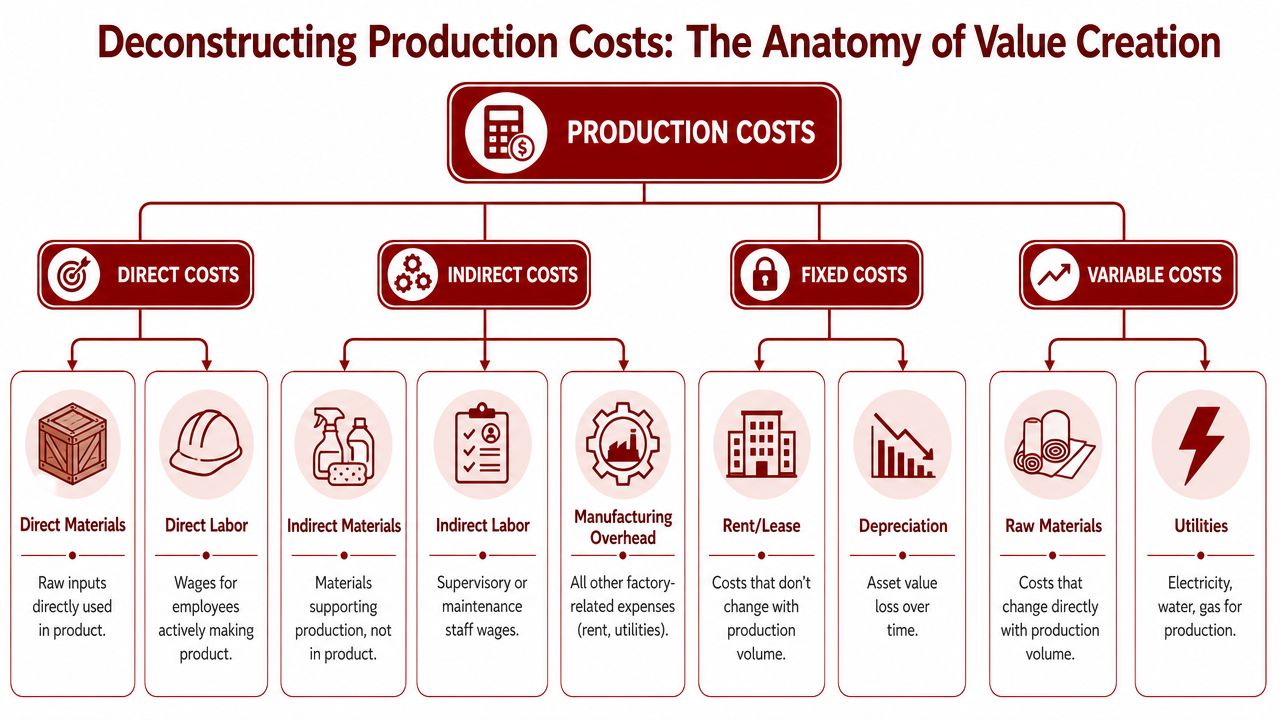
According to Novalink's manufacturing cost analysis discussion, direct costs typically constitute 60% to 70% of total manufacturing expenses, while indirect costs account for the remaining 30% to 40%. That split matters because many operators obsess over raw material pricing while letting overhead logic drift for years.
Start with the cost map
In a precision manufacturing environment, direct cost is the spending you can trace to the product without gymnastics.
That usually includes:
- Direct materials like titanium bar stock for a specific machined bracket, aluminum plate for a fixture, or resin consumed in a molded housing.
- Direct labor tied to the operator, machinist, assembler, inspector, or technician actively touching the work order.
- Machine-linked processing inputs when they're clearly attributable, such as tooling consumption or outside processing charged to that part number.
Indirect cost is different. It supports production but doesn't belong neatly to one unit at the moment it's incurred.
Examples include:
- Facility burden such as plant rent, utilities, and factory insurance.
- Support labor including supervision, maintenance, production planning, and quality management roles that serve multiple lines.
- Shared manufacturing overhead like depreciation on common equipment, calibration systems, material handling, and shop consumables.
Use two lenses at once
Direct versus indirect is one lens. Fixed versus variable is another. You need both.
A CNC machine lease is often fixed over the planning horizon. The cutting fluid, inserts, and raw metal consumed per additional unit are variable. Utilities can be mixed. Part of the bill behaves like a fixed plant cost, and part rises with spindle time, oven use, compressed air demand, or line throughput.
Cost categories should reflect how the operation actually runs, not how the chart of accounts happens to be organized.
That distinction affects pricing, budgeting, and capacity decisions. If you treat fixed costs like variable ones, you'll overreact to short-term volume swings. If you treat variable costs like fixed ones, you'll quote work that looks profitable on paper and loses money in execution.
For operators who want a plain-language refresher on this distinction, Nexist's insights on managing business costs offer a useful outside perspective.
What good classification looks like on the floor
A disciplined cost review asks practical questions, not abstract ones:
| Cost item | Best classification question | Typical manufacturing example |
|---|---|---|
| Material | Can we trace it directly to the unit? | Alloy, fasteners, PCB, adhesive |
| Labor | Is this labor consumed by the routing? | Setup, cycle monitoring, assembly |
| Overhead | Does it support the factory broadly? | Rent, maintenance, supervision |
| Fixed | Does it change with near-term volume? | Lease, salaried plant leadership |
| Variable | Does one more unit consume more of it? | Raw stock, inserts, freight tied to output |
If the team can't answer those questions quickly, the cost model isn't operational yet. It's just bookkeeping.
A 5-Step Methodology for Accurate Cost Analysis
A plant with 3,000 active SKUs can post acceptable gross margin overall and still destroy value every day. The usual culprit is not one bad month. It is a cost system that hides which parts make money, which parts absorb capacity, and which customer programs should have been repriced or exited six months ago.
That is why a repeatable production cost analysis process matters. Private equity teams use it to test earnings quality. Operators use it to stop subsidizing weak SKUs with a handful of strong ones. The cleanest framework is the five-step method outlined in Ramp's cost analysis methodology: define scope, identify all cost categories, gather data using ranges, calculate direct costs carefully, and allocate indirect costs using a consistent method tied to actual consumption.
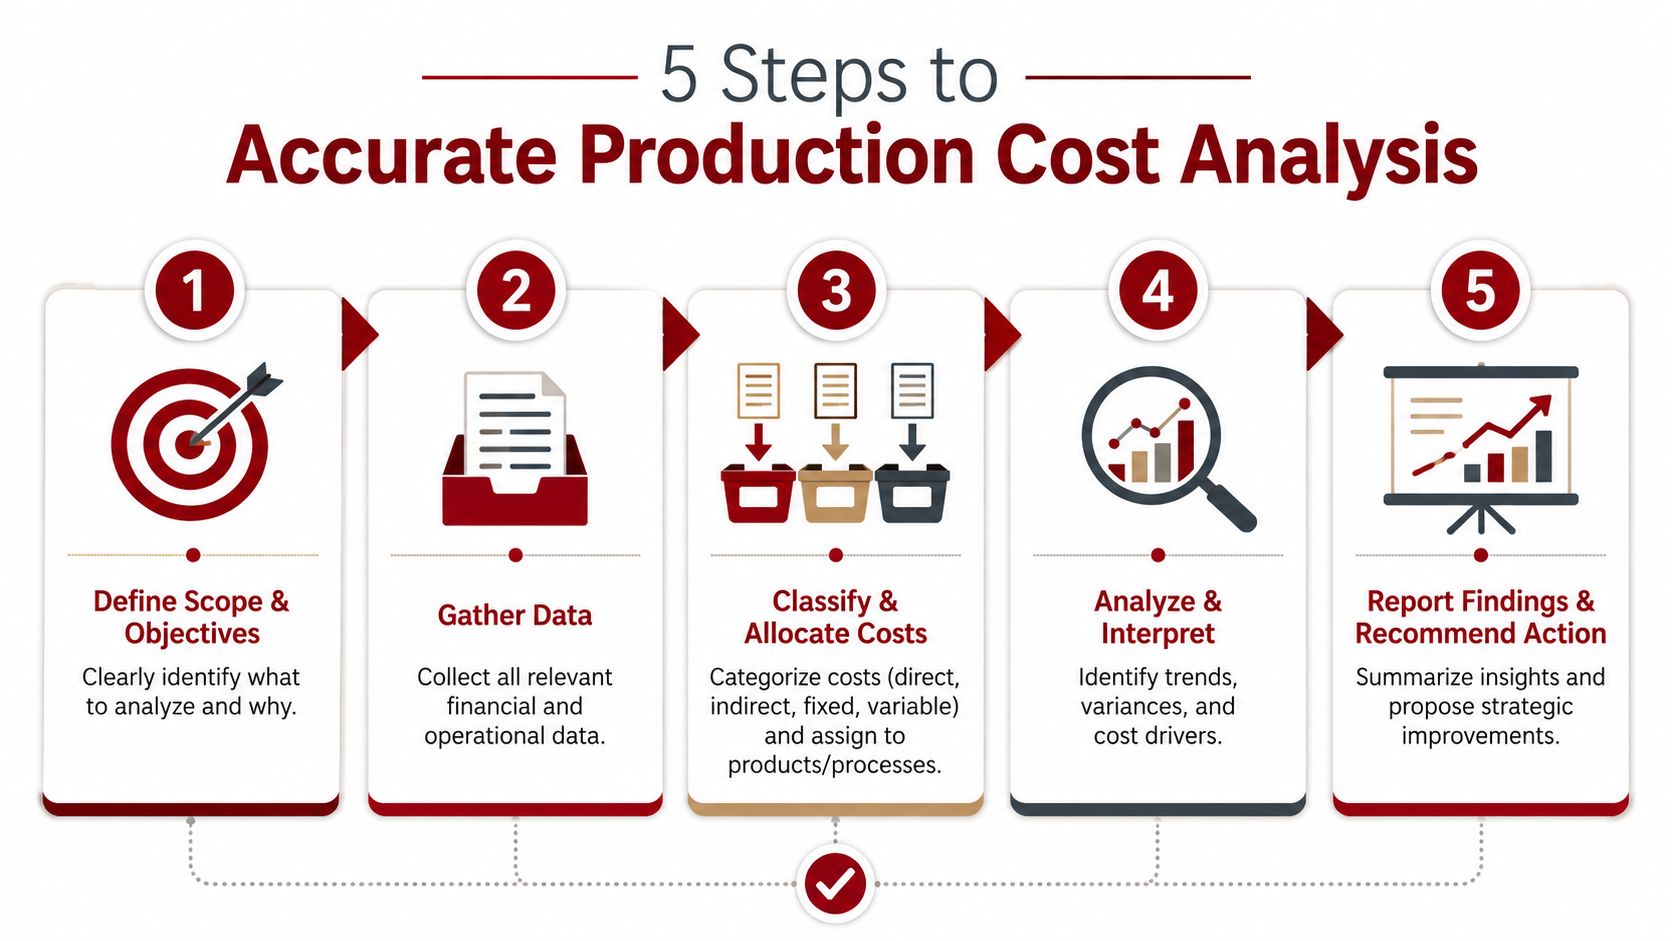
The steps are straightforward. Execution separates disciplined plants from plants that keep arguing over whose spreadsheet is right.
Step 1 and Step 2 set the boundaries
Step 1 is scope definition. Decide what decision the analysis needs to support. That could be a plant, a value stream, a product family, a customer program, or one SKU. In a multi-product factory, this choice matters more than teams expect. If the goal is to identify margin leakage, start at the SKU or product-family level. If the goal is to understand capacity economics, start at the work center, line, or process level.
Scope drift kills credibility fast. A team starts by asking why margins are down on one customer, then mixes in plant overhead changes, engineering exceptions, and legacy pricing assumptions. The result cannot support a pricing action, a sourcing change, or an investment case.
Step 2 is cost identification. Pull in the full cost stack tied to how the work is produced: material, direct labor, machine time, tooling, scrap, quality, outside processing, freight tied to output, supervision, maintenance, and plant support functions that production consumes.
Many manufacturers stop at BOM material, estimated touch labor, and one overhead percentage. That approach may satisfy a monthly close. It does not tell a CEO which SKUs deserve more volume, which ones need a price increase, and which ones should come off the schedule because they tie up good assets for weak returns.
A tighter digital backbone helps at this stage. When routing data, labor capture, machine signals, and actual output live in the same operating system, the cost conversation gets less political. It gets more factual. That is one reason serious operators pay attention to manufacturing execution systems MES.
Here's a useful walkthrough before moving deeper into implementation:
Step 3 and Step 4 make the numbers usable
Step 3 is data gathering. Use purchase history, current supplier agreements, labor standards, time studies, machine logs, scrap records, and recent outside processing invoices. Use ranges when inputs move. A resin price, alloy surcharge, or subcontract heat-treat cost should not be modeled as one frozen number if the business knows it changes.
Bad data creates false debates. I have seen management teams spend weeks arguing over labor productivity when the underlying issue was stale routing data and vendor pricing that had not been refreshed since the last contract cycle.
Step 4 is direct cost calculation. Each unit should absorb the costs that move with that unit's actual process path: material content, setup share, cycle time, operator time, tooling wear, outside services, inspection effort, and recurring consumables. Build the model from the current routing, not from the way engineering released the part years ago.
The best cost model in the world is useless if the router still reflects the way the part was made two engineering changes ago.
This step usually exposes the operational friction that accounting summaries hide. Setup assumptions are too low. Changeovers are happening more often than planned. Standard labor reflects ideal conditions, not current staffing. A supposedly profitable low-volume SKU turns out to consume disproportionate inspection time, premium material buys, and special handling.
That is the kind of finding that changes portfolio value. In a PE setting, buyers care less about the elegance of the worksheet and more about whether management can identify and act on margin erosion by SKU, customer, and process.
Step 5 determines whether the analysis is credible
Step 5 is indirect cost allocation. Here, many models lose the operating team. Burden has to follow real resource consumption closely enough that supervisors, estimators, and finance all recognize the answer as credible. Labor hours may work in a labor-intensive assembly environment. Machine hours may fit a highly automated machining cell. In other cases, setups, inspections, material moves, or activity drivers will produce a better answer.
Perfection is not the objective. Consistency is. If the allocation method changes every quarter, the business cannot tell whether margins moved because operations improved or because finance changed the math.
Review cadence matters too. Volatile input environments call for monthly updates. More stable operations may be fine with quarterly review, as noted earlier in the Ramp guidance. The test is simple: does the model move fast enough to protect price floors before weak-margin work fills the plant?
A disciplined review cycle should answer five questions every time:
- What changed in purchased material?
- Where did labor assumptions drift from actual routing behavior?
- Which overhead pools no longer reflect plant reality?
- Which products moved below acceptable margin?
- What action gets taken this month, not next quarter?
If those questions do not lead to repricing, rerouting, renegotiation, SKU rationalization, or capital allocation decisions, the exercise is still accounting. It is not production cost analysis.
Worked Example A CNC Machined Aerospace Component
A single aerospace part is enough to show why surface-level costing fails. Consider a CNC-machined structural component produced from high-spec raw stock, with multiple machining operations, inspection requirements, and finishing routed through approved outside processors.
How the cost buildup works
A practical cost model starts with the bill of materials and the routing, then adds the recurring realities that estimators often treat too lightly: setup absorption, tooling wear, inspection time, and overhead tied to the actual process path.
Here's a simple operating format for the analysis.
| Cost Item | Category | Cost per Unit | Notes |
|---|---|---|---|
| Raw material | Direct material | Calculated from contracted input cost and yield assumption | Use actual buy-to-fly logic, not nominal finished weight |
| CNC machine time | Direct conversion | Calculated from runtime and machine rate | Split setup from recurring cycle time |
| Operator labor | Direct labor | Calculated from loaded labor standard | Reflect actual touch time, not theoretical unattended time |
| Tooling wear | Direct conversion | Calculated from insert and tool life assumptions | Often missed in low-volume aerospace work |
| Inspection | Direct labor or indirect support | Calculated from inspection plan | First article and recurring inspection should be separated |
| Outside processing | Direct material or outside service | Calculated from approved vendor quote | Include freight and handling if recurring |
| Plant overhead | Indirect allocated cost | Allocated by chosen driver | Use a method consistent with resource consumption |
The point isn't the spreadsheet format. The point is the discipline. Each line should reflect how the part is made.
If a part looks expensive only after you allocate overhead honestly, the part was always expensive. The old model was just hiding it.
Where executives usually miss the signal
The most common mistake is comparing finished part price to raw material plus machine time and assuming the gross margin is sound. In aerospace machining, that shortcut misses support burden, quality effort, outside process handling, and design choices that make the part harder to produce than it needs to be.
That's why outlier analysis matters. According to aPriori's manufacturing cost analysis article, parts that sit one standard deviation above a best-fit line of cost estimate versus finished weight often need redesign, and those redesigns can reduce manufacturing expense by up to 15%. In practice, those are usually the parts with avoidable complexity. Tight tolerances stacked where they don't create value. Deep pockets that drive extra cycle time. Features that force extra setups.
A CEO should ask three direct questions when a part becomes a cost outlier:
- Is the design driving unnecessary process steps?
- Is the routing still the best manufacturing path?
- Are we carrying this part at a price that reflects actual effort?
When the answer to any of those is no, redesign and repricing belong on the table immediately.
Using Analysis for Pricing Budgeting and PE Diligence
Production cost analysis creates value only when it changes decisions. If the analysis ends in a monthly report and never touches quoting, budgeting, or diligence, the business has done the work and missed the payoff.
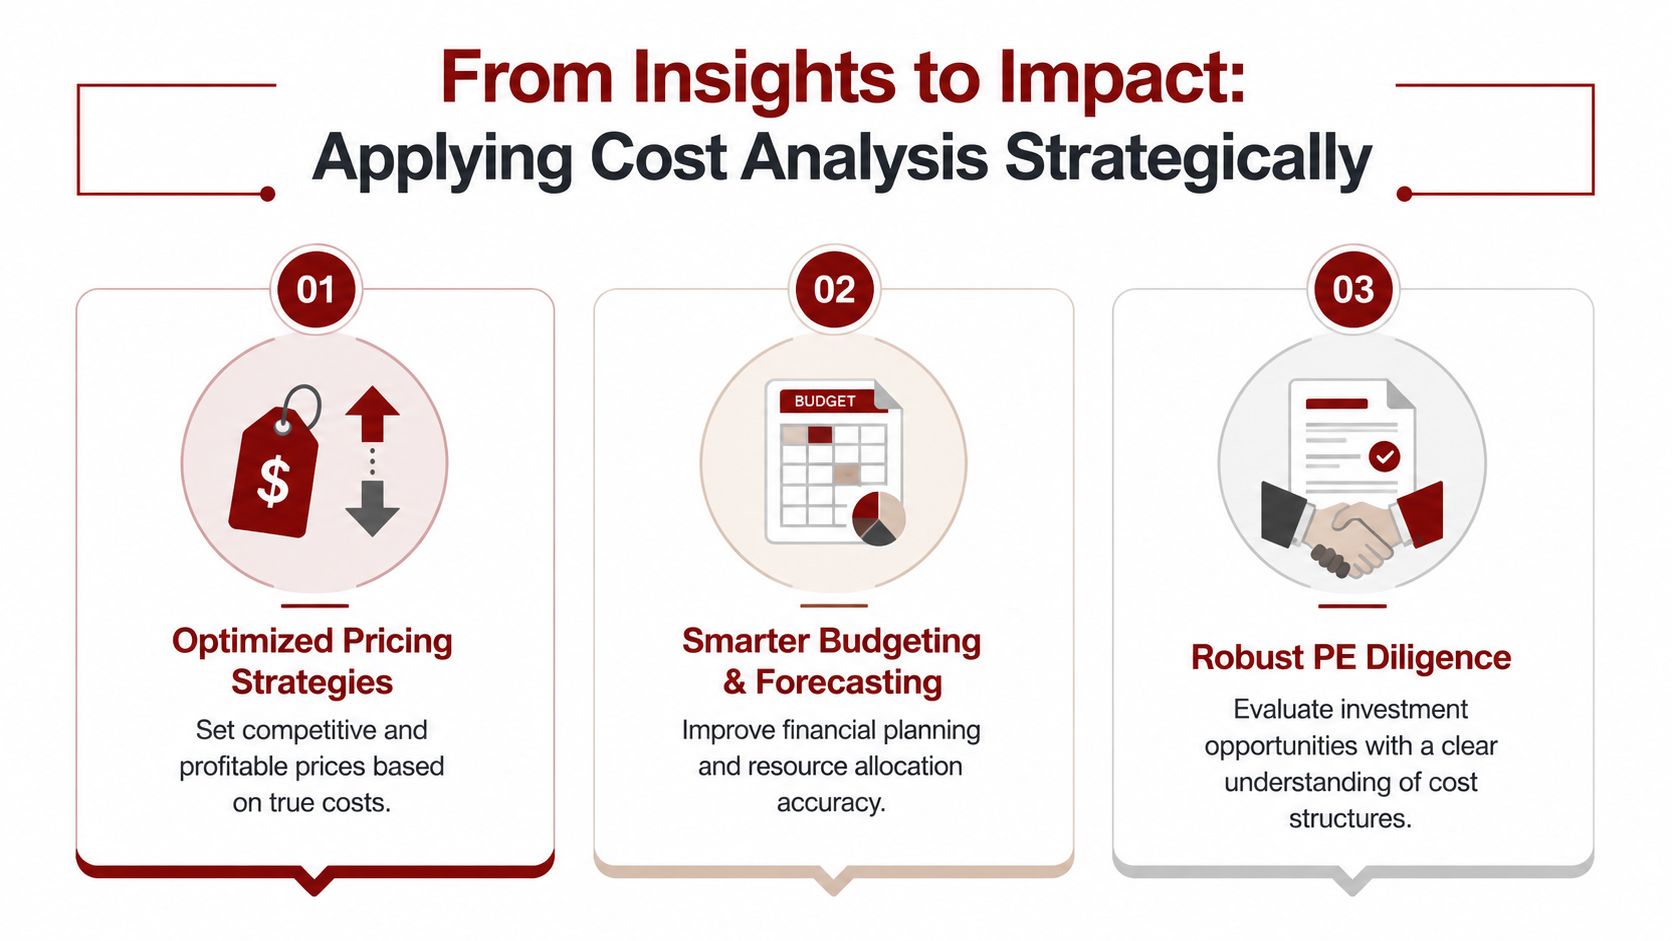
The most overlooked issue in multi-product manufacturing is SKU profitability blindness. As discussed in this analysis of multi-SKU cost gaps, 25% of SKUs often operate below breakeven, even when the company looks profitable in aggregate. That single insight explains why so many businesses grow revenue and lose margin at the same time.
Pricing decisions get sharper fast
Pricing starts with a floor. Not a sales target, not a hope, and not a market rumor. A floor. When the cost model is credible, management can separate strategic bids from accidental losses.
That changes commercial behavior in several ways:
- Low-volume custom work gets priced for disruption. Setup, engineering coordination, and quality burden stop being hidden subsidies.
- Repeat production gets segmented correctly. Mature parts with stable routings shouldn't carry the same uncertainty premium as volatile jobs.
- Customer negotiations get stronger. The team can explain what changed, where cost moved, and what must happen to preserve margin.
A lot of bad pricing stems from cross-subsidy. Profitable parts carry weak ones, and consolidated reporting hides the damage.
Budgeting and diligence improve for the same reason
Budgeting gets better when cost assumptions sit on real operating drivers instead of top-down percentages. Materials forecasts align more closely to actual mix. Labor plans reflect routing load. Overhead assumptions become explicit enough to challenge.
The same logic matters in transactions. Buyers want to know whether earnings are durable, whether pricing discipline exists, and whether hidden SKU losses are depressing cash generation. Anyone involved in acquisitions or exits should understand the mechanics of how financial due diligence works because cost analysis is one of the fastest ways to test whether reported profitability is structurally sound.
Good diligence doesn't just verify the numbers. It tests whether management understands why the numbers are what they are.
For private equity operators, the upside case hinges on the following. The deal thesis often isn't “grow faster.” It's “fix the mix, repair pricing discipline, rationalize unprofitable SKUs, and expand margin with operational clarity.”
Common Pitfalls and Strategic Improvement Levers
Most manufacturing teams don't fail because they ignore cost. They fail because they trust a cost system that no longer reflects the plant.
What breaks most cost systems
One recurring problem is sloppy indirect allocation. In complex environments, broad averages distort unit economics. According to aPriori's best practices on product manufacturing cost analysis, activity-based costing can improve decision-making precision by up to 20% in complex manufacturing environments because it links cost to the actual activities consuming resources.
That matters when one part family drives engineering support, inspections, setups, and handling far more heavily than another. If both absorb overhead the same way, one gets undercosted and the other overcosted.
Other failure points are less technical but just as damaging:
- Stale standards that haven't been updated after process changes, tooling changes, or supplier shifts.
- Ignored NRE and launch costs that get treated as one-time noise even when similar work recurs.
- Infrequent review cycles that leave old assumptions in place while material and process conditions move.
- ERP overconfidence where teams assume the system output is correct because it looks structured.
Where the real margin improvement comes from
The best margin gains usually don't come from one dramatic move. They come from several disciplined ones executed together.
A practical improvement agenda often includes:
- Design for manufacturability by removing unnecessary complexity, reducing setups, and matching tolerances to actual functional need.
- Strategic procurement through better should-cost logic, supplier renegotiation, and cleaner demand visibility.
- Process improvement that cuts wasted motion, queue time, rework, and routing friction; structured manufacturing process improvement work is essential here.
- Automation and digital visibility when they solve a known cost problem, not when they're purchased as a generic modernization project.
The companies that improve margins fastest are usually the ones willing to challenge product complexity, not just supplier pricing.
Production cost analysis should do more than explain yesterday. It should tell leadership exactly where to act next.
Hasit Vibhakar is a serial entrepreneur and CEO with over 25 years of experience building, scaling & increasing shareholder value across Aerospace, Advanced Manufacturing & Industrial sectors. If you're evaluating how to strengthen profitability, sharpen operational discipline, or prepare a manufacturing business for scale or exit, learn more at Hasit Vibhakar.


Leave a Reply