
You're probably living this right now. The plant is busy, shipments are moving, supervisors are chasing problems all day, and the weekly report still leaves you with a bad feeling. You have plenty of numbers, but not enough clarity. Then a lender, board member, or buyer asks a simple question about performance trend, and the room goes quiet because the data isn't clean, the definitions vary by site, and nobody trusts the dashboard enough to defend it.
That's why KPI measurements in manufacturing matter. Not as a reporting ritual. Not as a Lean poster on the wall. They matter because disciplined metrics tell the truth about whether your operation can scale, protect margin, and survive due diligence. Buyers don't pay premium multiples for activity. They pay for repeatability, visibility, and control.
About Hasit Vibhakar
Hasit Vibhakar is a serial entrepreneur and CEO with over 25 years of experience building, scaling & increasing shareholder value across Aerospace, Advanced Manufacturing & Industrial sectors. More information can be obtained at Hasit Vibhakar
Table of Contents
- Your KPIs on Trial The Real Reason They Matter
- Aligning KPIs with Strategic Value Not Just Output
- The Vital Few Selecting and Defining Core Manufacturing KPIs
- Building a Foundation of Trust Implementing Data Collection
- Visualizing Performance Crafting Dashboards That Drive Decisions
- Sustaining Excellence Through Governance and Sidestepping Traps
Your KPIs on Trial The Real Reason They Matter
I've seen this happen more than once. An owner walks into a diligence call convinced the conversation will center on growth projections, customer concentration, or backlog. Instead, the buyer asks about operational stability. They want to know how equipment efficiency has trended, whether quality is improving or slipping, and how management knows the numbers are real.
If your answer is vague, your valuation takes a hit before anyone says it out loud.
This is the fundamental function of KPI measurements in manufacturing. They're not an internal scorecard for plant managers. They're evidence. They prove that your margins aren't accidental, your output isn't fragile, and your leadership team knows what drives performance beneath the P&L.
Buyers don't trust heroic management stories. They trust disciplined operating data.
Too many teams track metrics because software makes it easy. They collect line-level noise, print colorful dashboards, and still can't explain whether the business is improving in a way that reduces risk for an acquirer. If you need a useful baseline on the broader role metrics play in commercial leadership, this primer on understanding KPIs for B2B growth leaders is worth a look because it reinforces the same principle. Metrics matter only when they connect action to business value.
Here's the blunt truth. A messy KPI system tells a buyer three things:
- Leadership lacks control: people are reacting to issues instead of managing a process.
- Forecasts are weak: if current operations aren't measured well, future projections won't be trusted.
- Synergy claims are harder to believe: strategic buyers want to know what they're integrating.
When your KPIs are chosen well, defined tightly, and reviewed with discipline, they become part of the equity story. They show that gains in output, quality, and delivery aren't random. They're repeatable. That's what gets paid for.
Aligning KPIs with Strategic Value Not Just Output
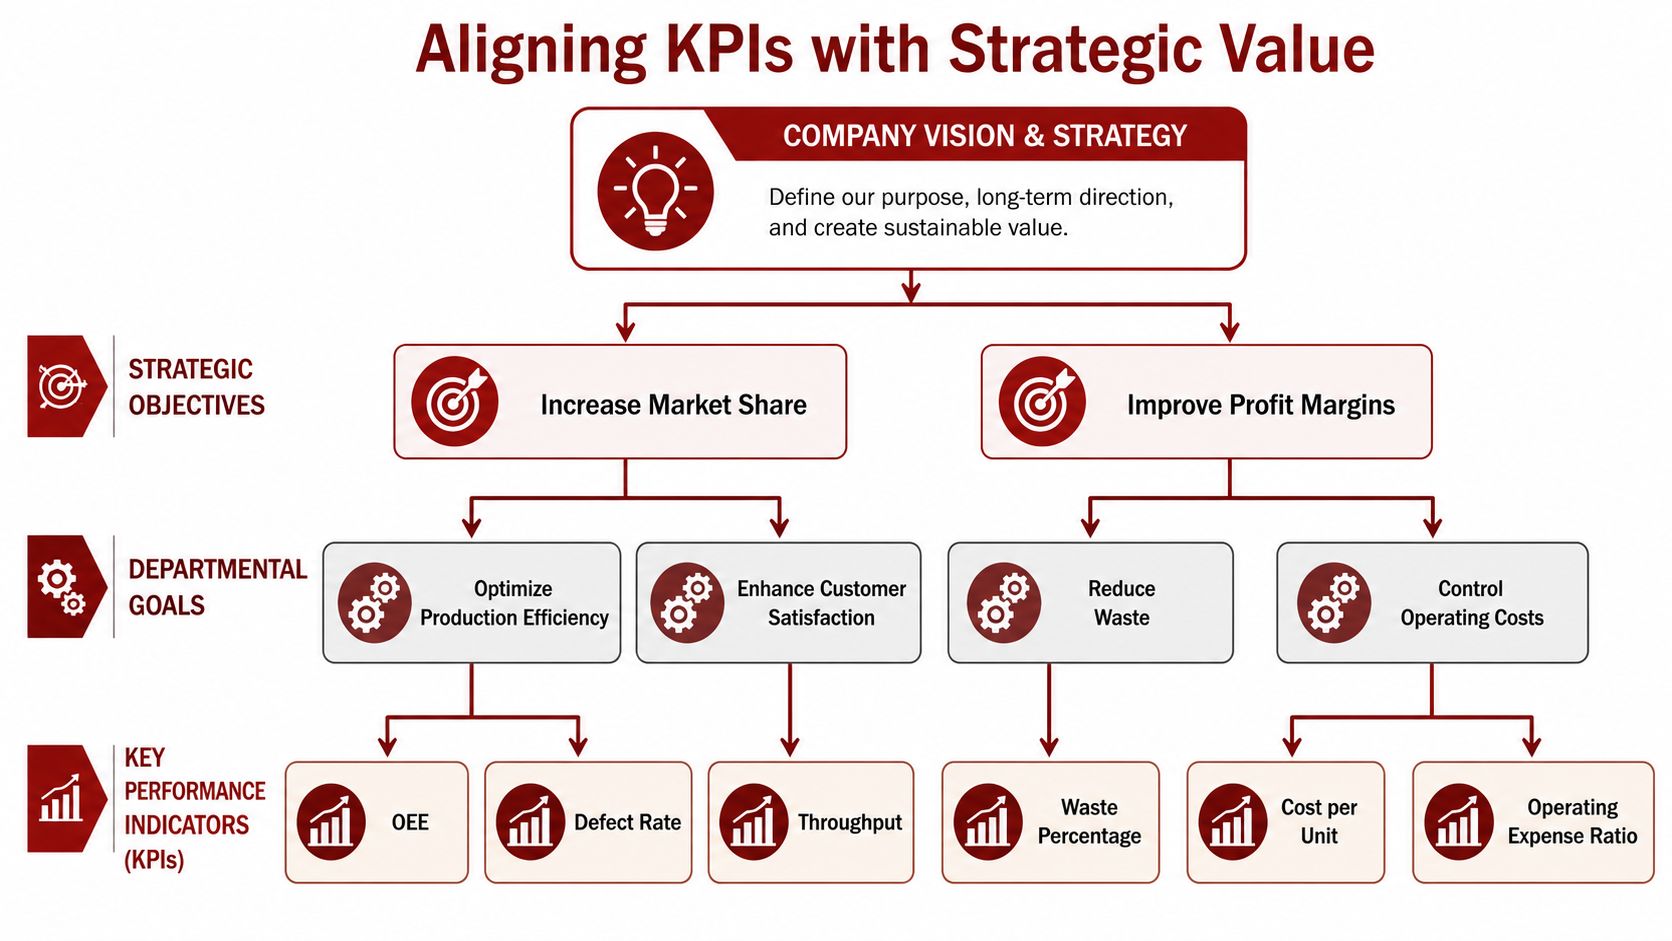
Most manufacturers choose KPIs backwards. They start on the floor, collect whatever the ERP, MES, or spreadsheet makes convenient, and then try to explain to the board why those numbers matter. That approach creates activity without direction.
Start at the top. If the company is preparing for a strategic sale, funding a capacity expansion, or trying to improve earnings quality, your KPI set has to flow from that objective. Otherwise you're measuring motion, not value.
Start with the buyer's lens
In advanced manufacturing facilities, OEE must be calculated as Availability × Performance × Quality, and Availability Loss is strictly defined by downtime events exceeding 5 minutes, a threshold that directly impacts buyer valuation during M&A transactions in aerospace, as explained in this discussion of business exit strategies in advanced manufacturing.
That fact matters for one reason. Buyers don't reward vague efficiency claims. They want standardized definitions that hold up under scrutiny.
A good executive team asks value-first questions:
| Strategic objective | KPI implication | What a buyer hears |
|---|---|---|
| Margin expansion | FPY, cost per unit, rework trend | “This operation converts revenue efficiently.” |
| Capacity without capex | OEE, cycle time, throughput | “There's room to grow before spending heavily.” |
| Supply chain resilience | supplier performance, incoming quality | “The business won't break under demand pressure.” |
If your commercial plan depends on reliable inputs, weak supplier discipline will show up in output and margin. That's why strong supplier relationship management in manufacturing belongs in the same conversation as KPIs. Procurement isn't separate from enterprise value. It feeds it.
Turn strategy into plant-level accountability
Top-down alignment doesn't mean executives ignore the floor. It means they translate enterprise goals into a small number of operational signals that affect valuation.
Use this filter before any metric makes the dashboard:
- Does it connect to cash, margin, capacity, or risk? If not, cut it.
- Can the metric be defined the same way across lines and sites? If not, fix the definition first.
- Can a supervisor influence it this week? If not, it may belong in finance, not operations.
- Would you defend it in diligence? If not, it doesn't belong in the board pack.
Practical rule: If a KPI can't explain why EBITDA quality is getting better or worse, it's probably a vanity metric.
The right KPI architecture starts with strategic intent, translates into operational behavior, and ends in financial proof. That's how output becomes enterprise value.
The Vital Few Selecting and Defining Core Manufacturing KPIs
You do not need fifty metrics. You need a disciplined handful that tells the whole story. In most scaling manufacturing businesses, the vital few are OEE, FPY, cycle time, throughput, and cost per unit. Everything else is secondary or diagnostic.
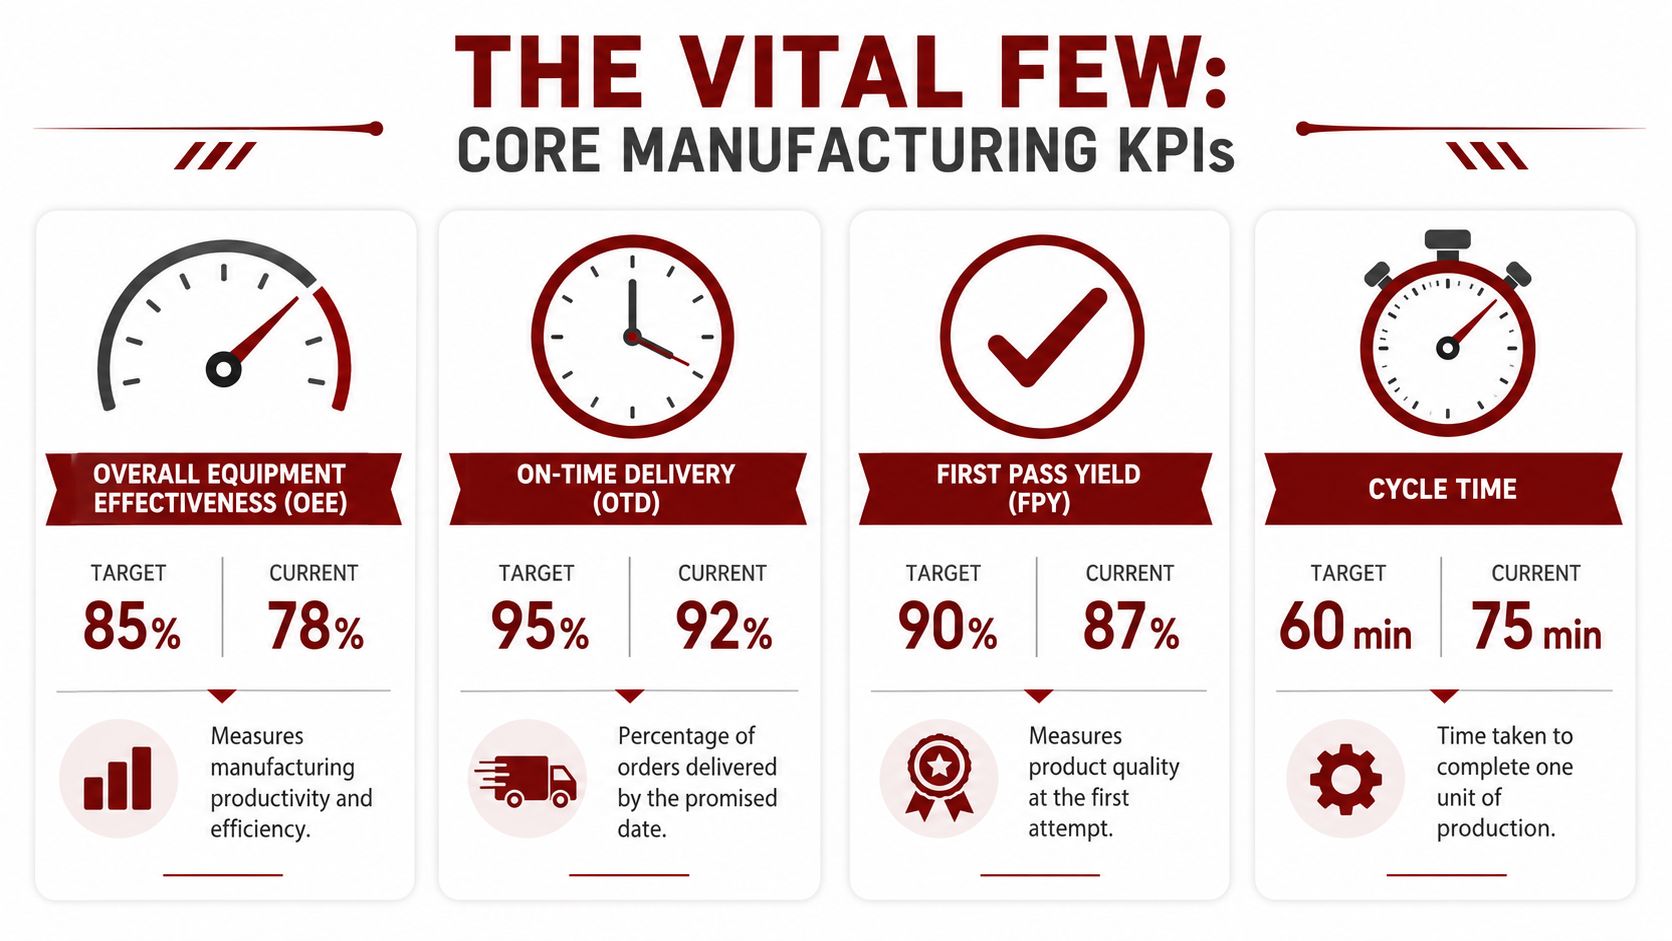
OEE tells the capacity story
Overall Equipment Effectiveness is still the clearest top-level measure of manufacturing productivity because it combines availability, performance, and quality into one number. It is the global gold standard for manufacturing efficiency, with 100% representing perfect production where equipment runs at full speed without defects or downtime. Industry data shows average OEE typically sits around 60%, while world-class operations reach 85% or higher. Moving from 60% to 85% can deliver a 25% increase in effective capacity without additional capital expenditure.
That's not an academic improvement. That's a buyer hearing, “This company may not need to spend on another machine yet.”
OEE also exposes where management is weak. If availability is poor, maintenance discipline is suspect. If performance lags, setup, micro-stops, or standard work may be the issue. If quality drags the score down, the process is producing waste faster than finance can hide it.
A sharper operating system usually starts with focused manufacturing process improvement in precision operations, not broad slogans.
Here's a useful explainer on the mechanics behind production KPIs:
FPY tells the quality and margin story
First Pass Yield is where quality becomes economics. FPY is the percentage of products meeting quality standards without rework. Average manufacturing FPY ranges between 70% and 75%, while world-class operations achieve 95% or higher. At 70% FPY, nearly 30% of production capacity is consumed by rework, scrap, and failure-related costs.
That's operational drag hiding inside your income statement.
Real-world data from precision manufacturing shows that improving FPY from 70% to 95% can reduce manufacturing cost per unit by 15% to 20%. That's why discerning buyers care about quality trends, not just customer complaints. FPY tells them whether quality is designed into the process or inspected in after the fact.
High FPY is a sign of managerial discipline. Low FPY is a tax on growth.
Cycle time throughput and cost per unit tell the economic story
These three metrics work together. None is especially impressive alone.
- Cycle time: This shows how long it takes to complete a unit or operation. If it's unstable, your schedule is fiction.
- Throughput: This tells you how much the line or plant produces in a given period. It's the operational output reality.
- Cost per unit: It highlights inefficiency in financial terms. If OEE and FPY improve but cost per unit doesn't, your accounting or assumptions need inspection.
A useful way to think about them is this:
| KPI | What it reveals | Why investors care |
|---|---|---|
| OEE | Utilization of existing assets | Capacity and capex timing |
| FPY | Quality without rework | Margin durability and customer risk |
| Cycle time | Process speed and stability | Lead time reliability |
| Throughput | Actual production output | Revenue conversion capability |
| Cost per unit | Economic efficiency | Profit quality |
A common error involves overloading the dashboard with derivative measures before they've locked these down. Don't do that. Define the vital few cleanly. Make managers own them. Then build diagnostics underneath.
Building a Foundation of Trust Implementing Data Collection
A KPI is only as good as the method used to capture it. If operators write numbers on paper, supervisors key them into spreadsheets, and finance adjusts them at month-end, you don't have a system. You have a chain of custody problem.
That becomes lethal in diligence.
Manual reporting breaks at scale
For FPY, the baseline must be defined as good units divided by total units entering the process, using the formula FPY = (Number of Good Units / Total Units Entering Process) × 100. Organizations that adopt automated FPY tracking have seen a 25–30% reduction in rework costs within the first 12 months, especially when paired with real-time data collection at minute-level intervals, according to this overview of manufacturing KPIs and automated FPY tracking.
That result doesn't happen because the metric is magical. It happens because automation removes delay, ambiguity, and hand-edited reporting.
If you're still relying on clerks or supervisors to re-enter production data from traveler packets, dispatch sheets, or machine notes, modern tools can reduce that administrative drag. This write-up on AI automation for job data entry is useful because it addresses the exact bottleneck many factories tolerate for too long.
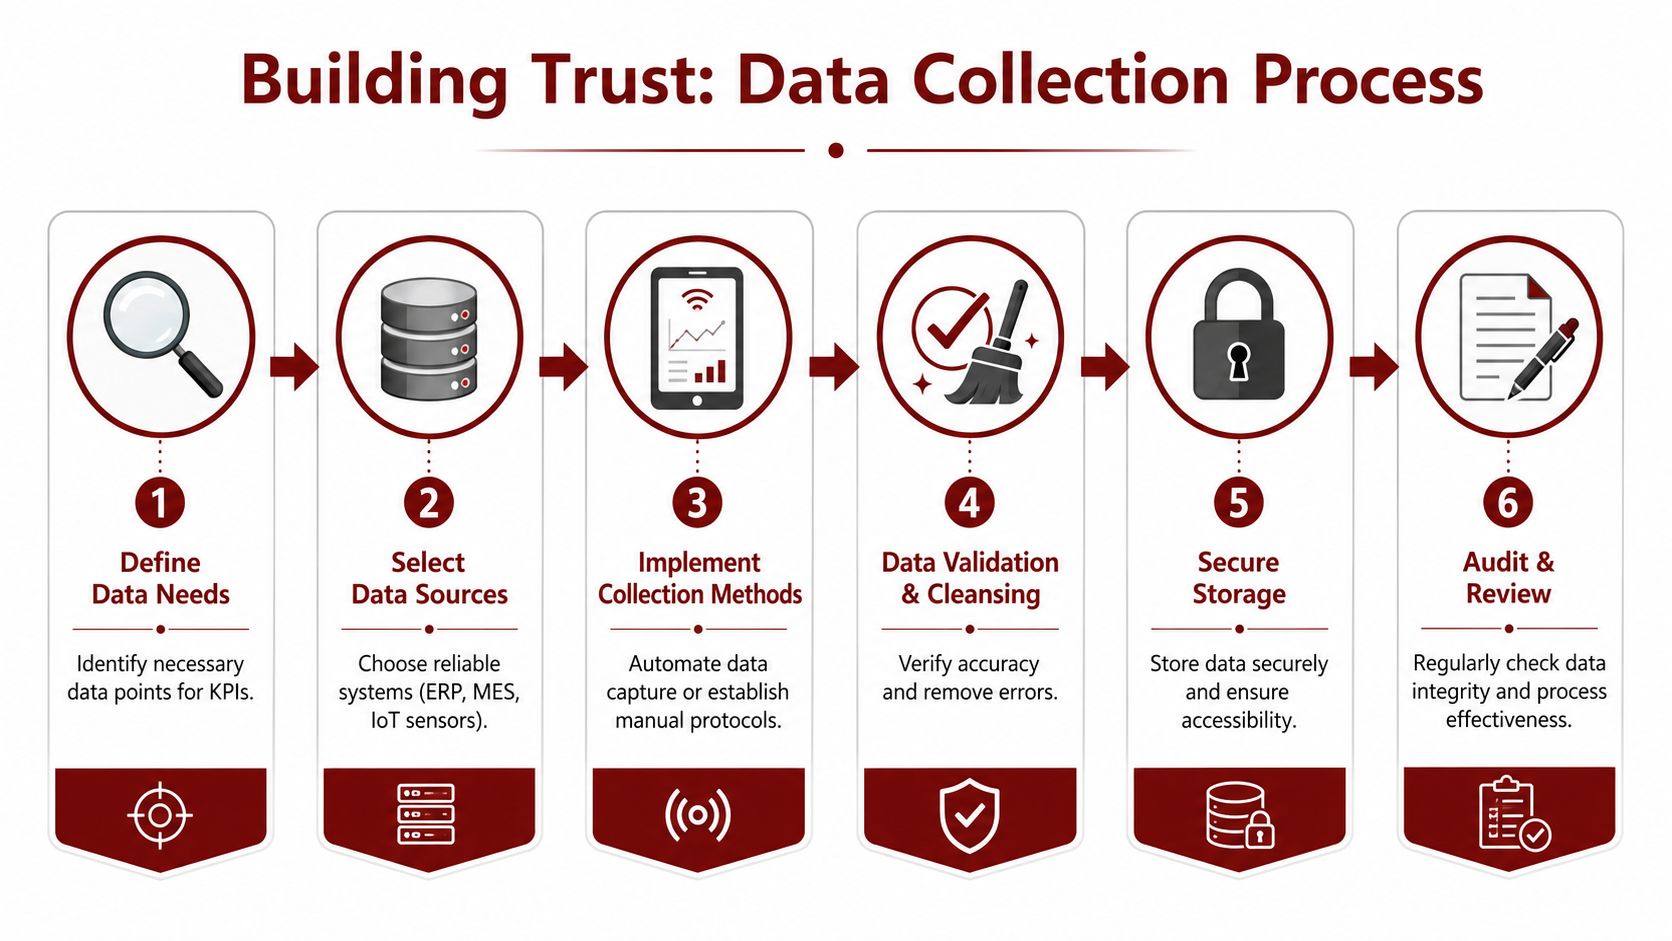
What a trustworthy collection system looks like
You need one source of truth, and it needs structure. In practical terms, that means a manufacturing data system should include:
- Clear machine states: running, planned downtime, unplanned downtime, setup, idle. If these states overlap, your KPIs are fiction.
- Timestamped events: not end-of-shift memory. Real timestamps.
- Automated capture where possible: direct feeds from machine controls, SCADA, MES, or connected devices.
- Validation rules: flag impossible run rates, missing counts, or duplicate entries.
- Auditability: every number should be traceable back to an event.
A modern manufacturing execution system for operational control gives you the backbone for this if it's configured correctly. But software alone won't save you. Definitions, ownership, and discipline matter more than the logo on the platform.
If an operator, plant manager, CFO, and buyer would each calculate the same KPI differently, the number is useless.
Use manual data collection only as a temporary bridge. Once the business is scaling, trusted KPI measurements in manufacturing require automated capture, validation, and a clean event model. Anything less creates false confidence.
Visualizing Performance Crafting Dashboards That Drive Decisions
Raw data doesn't improve a plant. A dashboard does, but only if it forces a decision. Most manufacturing dashboards fail because they try to impress instead of inform. They become digital wallpaper.

Different dashboards for different decisions
Your operator dashboard and your executive dashboard should not look alike.
The shop-floor view needs immediacy. It should answer basic questions fast. Is the line running? What's down? Where did the last quality loss happen? Which order is behind? If an operator has to scroll through six widgets to find the answer, the dashboard is badly designed.
The executive view needs trend and financial implication. Improving FPY from 70% to 95% can reduce manufacturing costs per unit by 15% to 20%, so an executive dashboard should never show FPY as an isolated quality score. It should connect FPY trend to rework burden, margin pressure, and shipment reliability.
A simple split works well:
| Audience | Dashboard focus | Bad habit to avoid |
|---|---|---|
| Operators | real-time state, current target, exception alerts | cluttered historical analysis |
| Supervisors | shift trend, root-cause drill-down, accountability | vanity summaries |
| Executives | trend lines, plant comparisons, financial impact | excessive line-level noise |
Design dashboards that force action
Three rules matter.
First, favor trends over snapshots. One point-in-time green number can hide a deteriorating week. Second, pair lagging metrics with leading signals. FPY belongs beside defect and non-conformance indicators, not buried in a quality tab. Third, use drill-downs intentionally. Every red KPI should lead to a cause path, not a dead end.
If your team needs a refresher on presentation discipline, this guide for impactful data visuals is useful because it focuses on making visual information easier to interpret rather than merely prettier.
A dashboard should answer one question fast. What needs action today?
Here's what to keep and what to cut:
- Keep trend lines: they show whether improvement is sustained.
- Keep thresholds and context: a number without target or baseline invites argument.
- Cut decorative gauges: they look nice and waste space.
- Cut duplicate widgets: repeated KPIs with different colors create confusion.
- Keep drill-down logic: executives should move from plant to line to event without a scavenger hunt.
A dashboard isn't a report. It's a management tool. Build it so a supervisor can intervene in minutes and an investor can understand the business in one screen.
Sustaining Excellence Through Governance and Sidestepping Traps
The companies that get value from KPIs don't treat them like a project. They run them like a management system. That means definitions are documented, owners are assigned, review cadence is enforced, and exceptions trigger action.
Without governance, even good metrics decay.
Governance is where KPI systems live or die
Start with a KPI dictionary. Every metric needs a written definition, formula, data source, owner, review frequency, and escalation path when performance slips. If you have multiple plants, this dictionary is non-negotiable.
Then set operating rhythm. Daily huddles should handle immediate exceptions. Weekly reviews should address trends and root causes. Monthly leadership reviews should connect operational movement to financial impact and strategic priorities.
Use a simple governance checklist:
- Assign ownership: one person owns each KPI. Shared ownership usually means no ownership.
- Document definitions: if a metric can be interpreted two ways, people will choose the flattering one.
- Review exceptions, not theater: meetings should focus on gaps, causes, and actions.
- Version-control changes: if you alter a formula, log it. Don't rewrite history.
The traps that wreck credibility
The biggest trap is inconsistency across sites. Data shows that 68% of multinational manufacturers struggle with “plant A's OEE vs. plant B's OEE” debates due to non-aligned data models, and 42% of failed AI-driven optimization initiatives stem from unstandardized input signals. Emerging best practices require normalizing signals like downtime and cycle counts into a single data model before visualization, as outlined in this analysis of cross-site manufacturing KPI standardization.
If your sites define downtime differently, compare quality using different thresholds, or classify production states inconsistently, your roll-up dashboard is political theater.
The second trap is gaming. If compensation is tied to one visible number, people learn how to protect the metric instead of improving the process. That's why metric families matter. OEE without quality context can be manipulated. Throughput without cost discipline can destroy margin. Delivery without FPY can push defects downstream.
The third trap is passivity. Leadership teams love dashboards because dashboards feel modern. But no KPI system creates value until somebody changes behavior because of it.
Standardization isn't bureaucracy. It's the price of credibility.
The hard truth is simple. KPI measurements in manufacturing either become part of how the company runs, or they become decoration. The businesses that command strong exits choose the first path.
If you're building a manufacturing company for scale, profitability, or a strategic exit, disciplined operating metrics aren't optional. They are part of the value story. Hasit Vibhakar brings decades of hands-on leadership across aerospace, advanced manufacturing, and industrial businesses, with deep experience building companies, improving operations, and increasing shareholder value.

Leave a Reply